
Sound Waves
A sound wave is a vibration belonging to the category of longitudinal mechanical waves. It propagates using the particles of a medium, creating areas of compression and
rarefaction.
When a sound wave is produced, it interacts with the particles of matter. Here is what happens when a source emits a sound wave that propagates through the air.
-
When the speaker is turned off, no sound wave is produced. The air particles are distributed relatively uniformly.

-
When the speaker is turned on, its membrane oscillates, producing sound waves. The propagation of the oscillations leads to an alternation of the regions where the particles are closer together (compression region) and regions where the particles are farther apart (rarefaction region).

-
When the speaker is turned off and the sound wave stops propagating, the air particles return to their original state. They are once again distributed relatively evenly. In fact, the wave has moved, and not the air particles.

We can represent the sound wave in several ways.
Representation 1 highlights the displacement of the air particles due to the propagation of the sound wave.

Representation 2 highlights the position of the compression region.

Representation 3 is a graph showing the variation in pressure in relation to the distance travelled by a sound wave. The graph is often represented without the axes identified.

A sound wave can be described using several characteristics that affect how it propagates and how it is perceived by the human ear.
Be careful!
Although the shape of their curves is similar, the graph of a transverse wave (such as visible light) and the graph of a longitudinal wave (such as sound) do not represent the same information.
A transverse wave can be represented by a graph of the vertical distance travelled by the wave |(y)| in relation to its horizontal distance travelled |(x)|. The graph represents how the transverse wave travels. In fact, it moves perpendicularly to the medium, by making oscillations.

Graphic representation of a transverse wave
In the case of a sound wave, the graph shows the change in pressure |(y)| in relation to the horizontal distance travelled by the wave |(x)|. Despite the shape of the curve, the graph does not represent how the sound wave travels. In fact, the sound wave does not go up and down. It moves parallel in the medium.
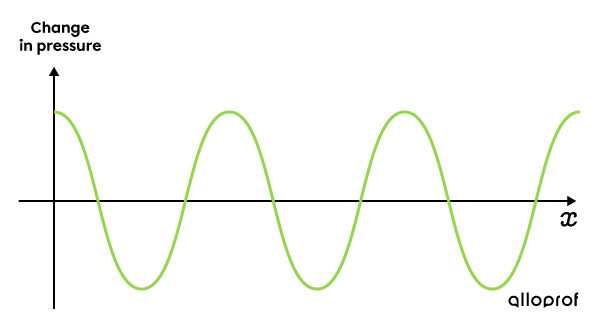
Graphic representation of a sound wave
Propagation Speed of the Sound Wave
Since a sound wave is a mechanical wave, a medium made up of particles is necessary for it to propagate. Therefore, the propagation medium of the sound wave has an impact on the propagation speed.
In a vacuum, a sound wave does not propagate because there is no medium to propagate the sound. Therefore, we can assume the speed of sound is zero. It is why we do not perceive sound in a vacuum.
As explained in the particle model, gaseous particles are spaced far apart, which reduces the speed at which a sound wave propagates. So, sound travels at about |343\ \text{m/s}| in the air. In a liquid state, particles are relatively close to each other. Consequently, the transmission of motion from particle to particle in this medium is done more quickly than in a gaseous sample. For example, sound travels at an average speed of |1\ 480\ \text{m/s}| in water.
The following table shows the average speed of sound in different mediums.
| Medium for sound propagation | Speed of sound |(\text{m/s})| |
|---|---|
| Air | |343| |
| Rubbing alcohol | |1\ 160| |
| Water | |1\ 480| |
| Marble | |3\ 810| |
| Steel | |5\ 960| |
Data source: LumenCandela, 2017.
Frequency of a Sound Wave and Pitch
The frequency |(f)| of a sound wave is a property that affects the sound’s pitch.
When particle compression regions are farther apart, like in sound wave 1, the frequency of the sound waves is low. Low frequencies seem low-pitched to the human ear.
When the particle compression regions are closer together, like in sound wave 2, the frequency of the sound waves is higher. They sound high-pitched to the human ear.

Comparison of the frequency of two sound waves
A double bass emits sounds that are lower in frequency than the violin’s. So, the violin sounds more high-pitched than the double bass.
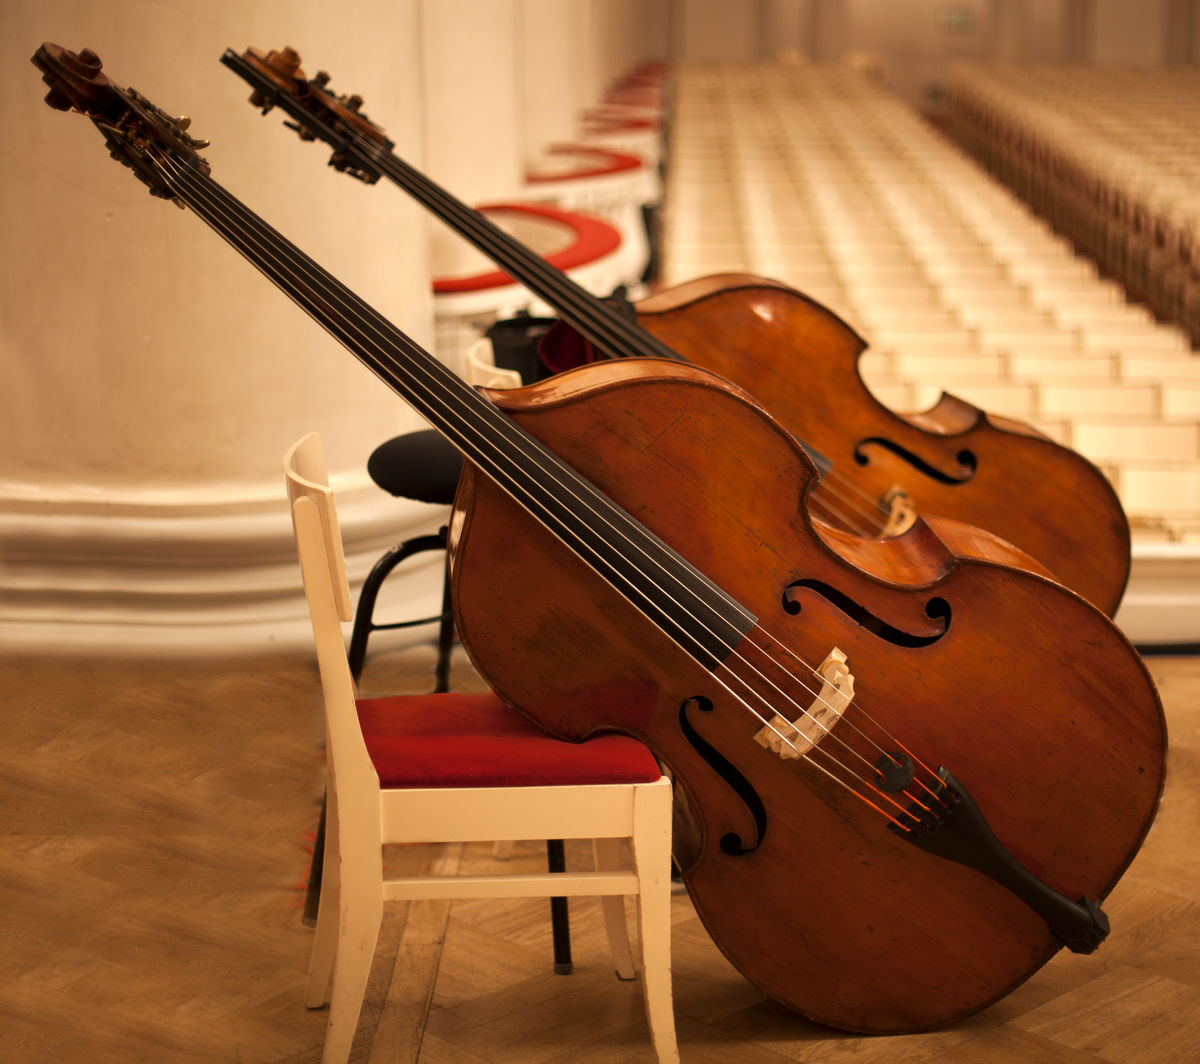
Maxim Tarasyugin, Shutterstock.com
In general, the human ear can perceive sounds with frequencies between |20\ \text{Hz}| and |20\ 000\ \text{Hz}.| However, with age, the auditory system deteriorates and the interval decreases.
Depending on the species, the range of perceptible frequencies varies. For example, a dog’s sound perception varies from |15| to |50\ 000\ \text{Hz},| and a moth’s varies from |3\ 000| to |150\ 000\ \text{Hz}.|
Amplitude of a Sound Wave and the Decibel Scale
The amplitude |(A)| of a sound wave determines the intensity of a sound, or loudness. The larger the sound wave’s amplitude, the louder the sound’s volume.
A kitten’s meowing sound is relatively low. The intensity of the sound, or volume, is also low.

Otsphoto, Shutterstock.com
A concert emits sounds with a relatively high amplitude. The intensity of the sound waves, or volume, is also high (loud).

Piotr Piatrouski, Shutterstock.com
Sound volume is measured using the decibel scale.
The decibel scale is a scale used to classify and quantify the relative loudness of a sound. The units of the scale are decibels |(\text{dB}).|
The decibel scale is a logarithmic one. For each increase in |10\ \text{dB},| sound intensity is 10 times more intense. For example, |40\ \text{dB}| is 10 times louder than |30\ \text{dB}.| Also, decibels don't add up. So, two distinct sounds at |50\ \text{dB}| by two normal voices do not add up to |100\ \text{dB}.|
The hearing threshold (the relative intensity a human ear can perceive) is |0\ \text{dB}.| The danger threshold (the relative intensity dangerous to the human ear) is |120\ \text{dB}.|

The frequency and duration of exposure to loud sounds directly impacts ear health. A volume of |100\ \text{dB}| already poses a serious risk to the auditory system. Beyond |120\ \text{dB},| the damage may be irreversible.
Dangerous sounds actually damage the hair cells of the inner ear, reducing the ability of the ear to pick up certain sounds.
The following table indicates the exposure times which should not to be exceeded in order to avoid damage to the auditory system (depending on the sound level).
| Sound level |(dB)| | Maximum exposure time |
|---|---|
| |85| | |8\ \text{h}| |
| |88| | |4\ \text{h}| |
| |91| | |2\ \text{h}| |
| |94| | |1\ \text{h}| |
| |97| | |30\ \text{min}| |
| |100| | |15\ \text{min}| |