
Acceleration
Acceleration is the ratio between the change in velocity of a moving body and the time required to effect this change in velocity.
When a car starts driving after stopping at a traffic light, its velocity increases: it accelerates. On the other hand, if the same car brakes to stop at a stop sign, its velocity decreases: its acceleration is negative. In everyday language, the car is said to be decelerating.
The general equation used to calculate the acceleration of a moving body is:
|a=\dfrac{\Delta v}{\Delta t}|
where
|a|: acceleration of the moving object in meters per square second |\text{(m/s}^2)|
|\Delta v| : change in velocity |( v_\text{f} - v_\text{i})| in meters per second |\text{(m/s)}|
|\Delta t|: change in time |( t_\text{f} - t_\text{i} )| in seconds |\text{(s)}|
The above formula is equivalent to calculating the slope of a straight line in a graph. In fact, if you have a graph showing the velocity of a moving object as a function of time, calculating the slope of this graph allows you to determine the acceleration of the moving object.
Be careful!
Acceleration is measured in metres per square second |\small \text {(m/s}^2)|. These units are based on the acceleration formula.
||\begin{align} a = \displaystyle \frac {\triangle v}{\triangle t} \quad \Rightarrow \quad
a &= \displaystyle \frac {\text {m/s}}{\text {s}} \\
&= \displaystyle \frac {\text {m}}{\text {s}} \times \frac {1}{\text {s}} \\
&= \displaystyle \frac {\text {m}}{\text {s}^{2}} \end{align}||
The mistake often made is to cancel out the units of time in the calculation : they are very important, however, since acceleration represents a change in velocity over a period of time.
From a graphical point of view, two relationships can be obtained:
| If the graph of acceleration over time shows a function of zero variation which is not superimposed on the x-axis, the moving body is accelerating (if the straight line is above the x-axis) or decelerating (if the straight line is below the x-axis). | If the graph of acceleration overf time shows a zero variation function superimposed on the x-axis, the moving body is moving at constant velocity without accelerating. This can also mean that the moving body is not in motion. |
|
 |
 |
As with velocity, there are two types of acceleration:
- Average acceleration, which determines the change in velocity over a predetermined time interval;
- Instantaneous acceleration, which determines the acceleration at a given moment.
A car stopped at a road sign accelerates after making its compulsory stop. Its velocity as a function of time is represented on a graph. What is the average acceleration of the car during the first five seconds of its distance travelled?

To determine the acceleration, we need to determine the velocity change and the time change. The question states that the time variation is five seconds. Looking at the graph, the last point shows that after five seconds, the car was travelling at a velocity of |\small \text {10 m/s}|. Using the acceleration formula, we get :
||\begin{align} a = \displaystyle \frac {\triangle v}{\triangle t} \quad \Rightarrow \quad
a &= \displaystyle \frac {\text {10 m/s}}{\text {5 s}} \\
&= {\text {2 m/s}^2} \end{align}||
The car therefore accelerated by |\text {2 m/s}^2|. A positive acceleration means that the car was increasing its velocity in the same direction as its motion.
Graph of Acceleration Over Time
The graph of acceleration over time tells us how an object's velocity is changing at any given moment.

- During the first two seconds, the object accelerates positively. This means that its velocity increases more and more. Nothing is known about the direction of the object, as it could have a negative velocity and a positive acceleration.
- The object stops accelerating. The object may be either stationary or at a constant velocity: this information cannot be determined from the acceleration graph alone.
- During the third segment, the object has an acceleration of |\small \text {-4 m/s}^2|. A negative acceleration represents an object changing velocity in the opposite direction to the reference orientation. The velocity will either decrease (if it was positive) or increase (if it was negative at the start of this segment).
- The object stops accelerating. As in segment 2, the object can be either stationary or at constant velocity.
- The object accelerates. Its velocity increases if it was positive at the start. If the initial velocity was negative, it will approach |\small \text {0 m/s}| and possibly exceed it (depending on the situation).
Determine the Velocity Changes (Area Under the Curve)
In a graph of acceleration over time, the area under the curve indicates the velocity changes that the object will undergo within a time interval.
Calculate the velocity changes undergone by the object between the eighth and tenth seconds.
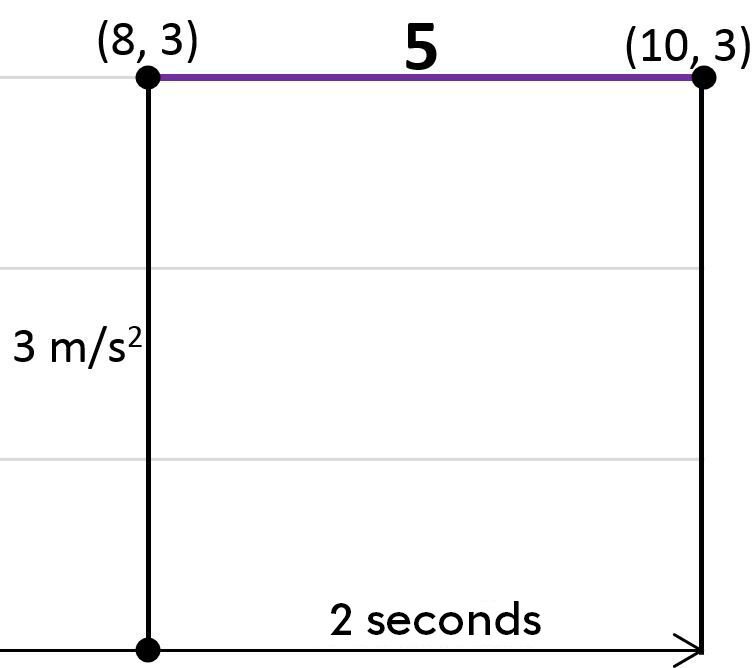
See solution
Be careful!
When the area under the curve represents a zone below the x-axis, a negative velocity change is calculated. This negative value is logical, as acceleration below the x-axis is negative. This means that the velocity is decreasing (if it was greater than zero at the start) or that the velocity is increasing, but in the opposite direction to that of the x-axis reference system.